For water and wastewater plants

Your plant's spreadsheets, as one app.

Operators enter the day's readings once. The dashboard, the alarms, tomorrow's wasting rates and the monthly numbers come out of them. It's set up for your tanks, your tests and your permit, and it can run on your own computer if your IT prefers.

Built with the operators of a working activated-sludge plant, on their own records back to 2023. The demo runs on a made-up plant.

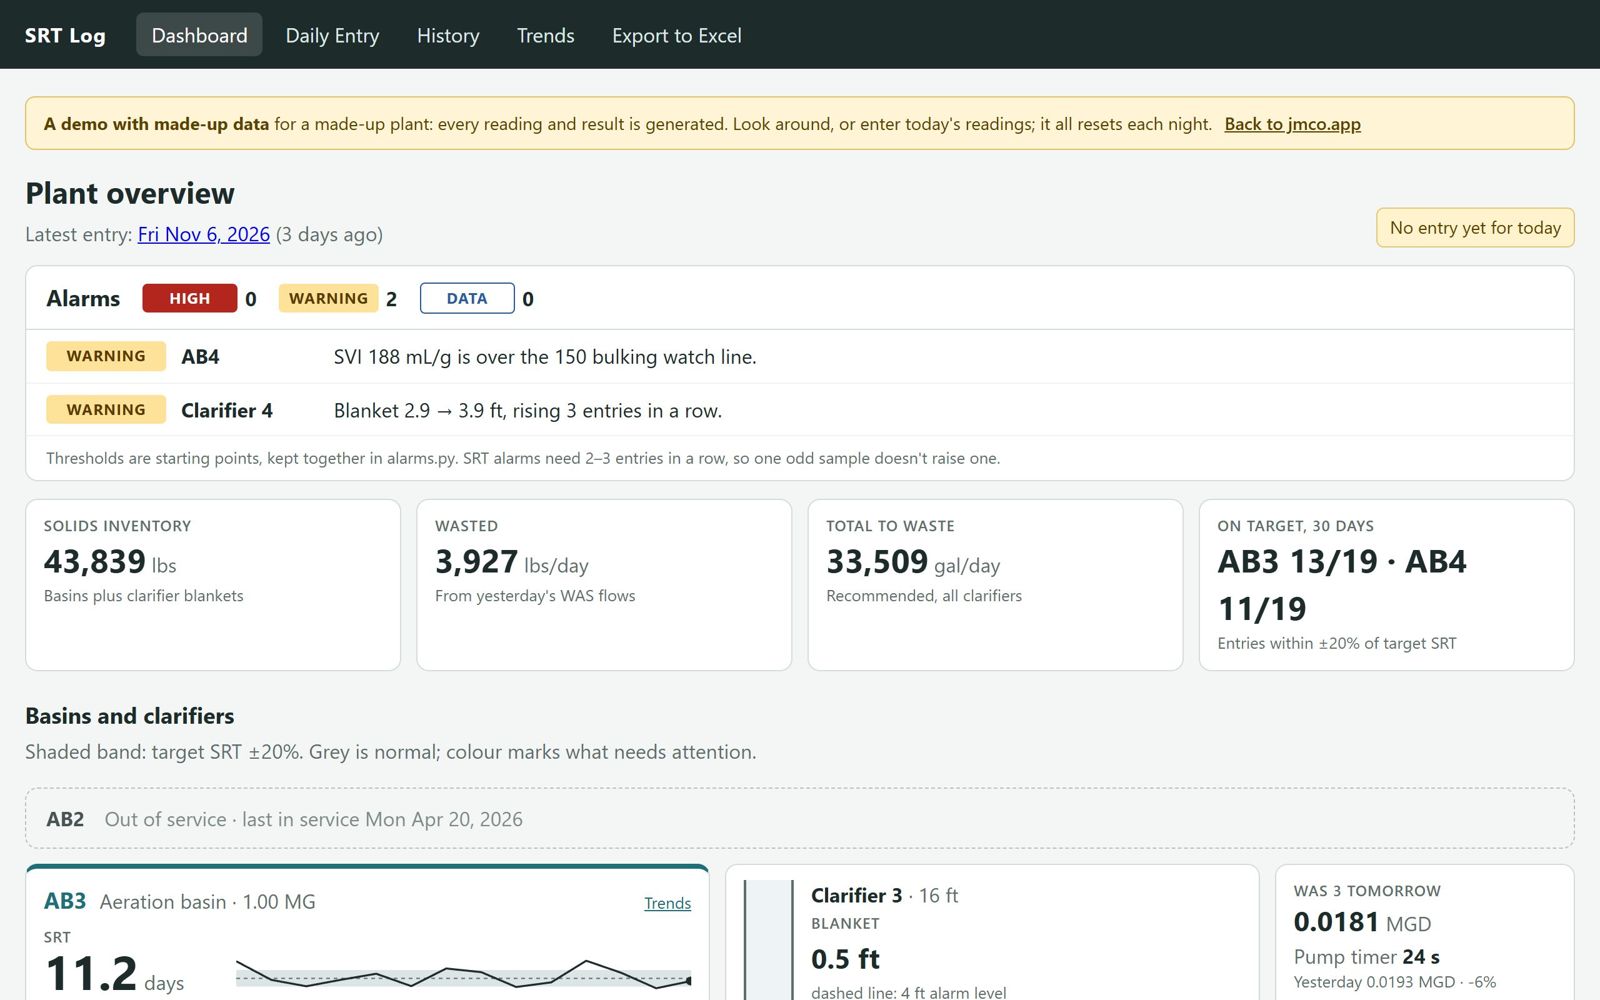
The plant dashboard: two warnings (a high SVI and a rising clarifier blanket), solids inventory, sludge wasted, the recommended total to waste and how many days each basin was on target
The morning view: what needs attention first, then each basin and clarifier.

Where the hours go now.

Most small and mid-size plants run on a spreadsheet per day, a binder per year and a monthly report done by hand. It works, until someone asks for last spring's numbers.

The same number, three times

Lab results go on the bench sheet, then the daily spreadsheet, then the monthly report. Every copy is a chance to get one wrong.

The monthly report, by hand

Averages, weekly maximums and percent removal are worked out at month's end, and a wrong average is a permit problem.

History nobody can see

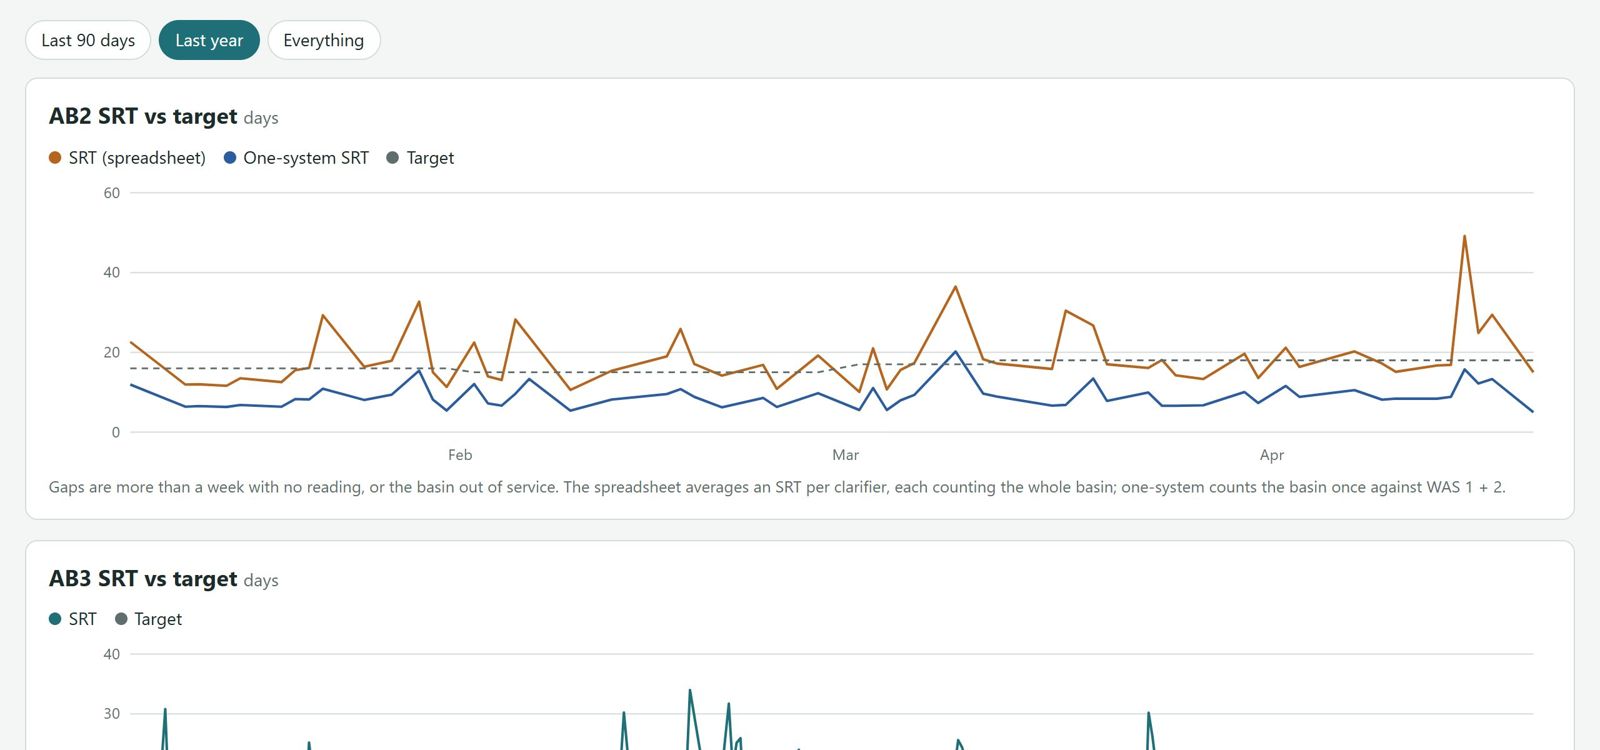
Years of readings sit in hundreds of files. Spotting a slow drift in settling or a basin that's been off target for weeks means opening them one by one.

What it does.

Four parts that share one set of readings. The daily log is working today; the rest is being built now with the operators who'll use it, and plants that join early help decide what it does.

Working today

The daily log and dashboard

The day's readings in one form, with results worked out as they're typed.

  • SRT, SVI, sludge inventory, wasting rates and pump timers
  • Alarms when a basin drifts, a blanket rises or a reading looks wrong
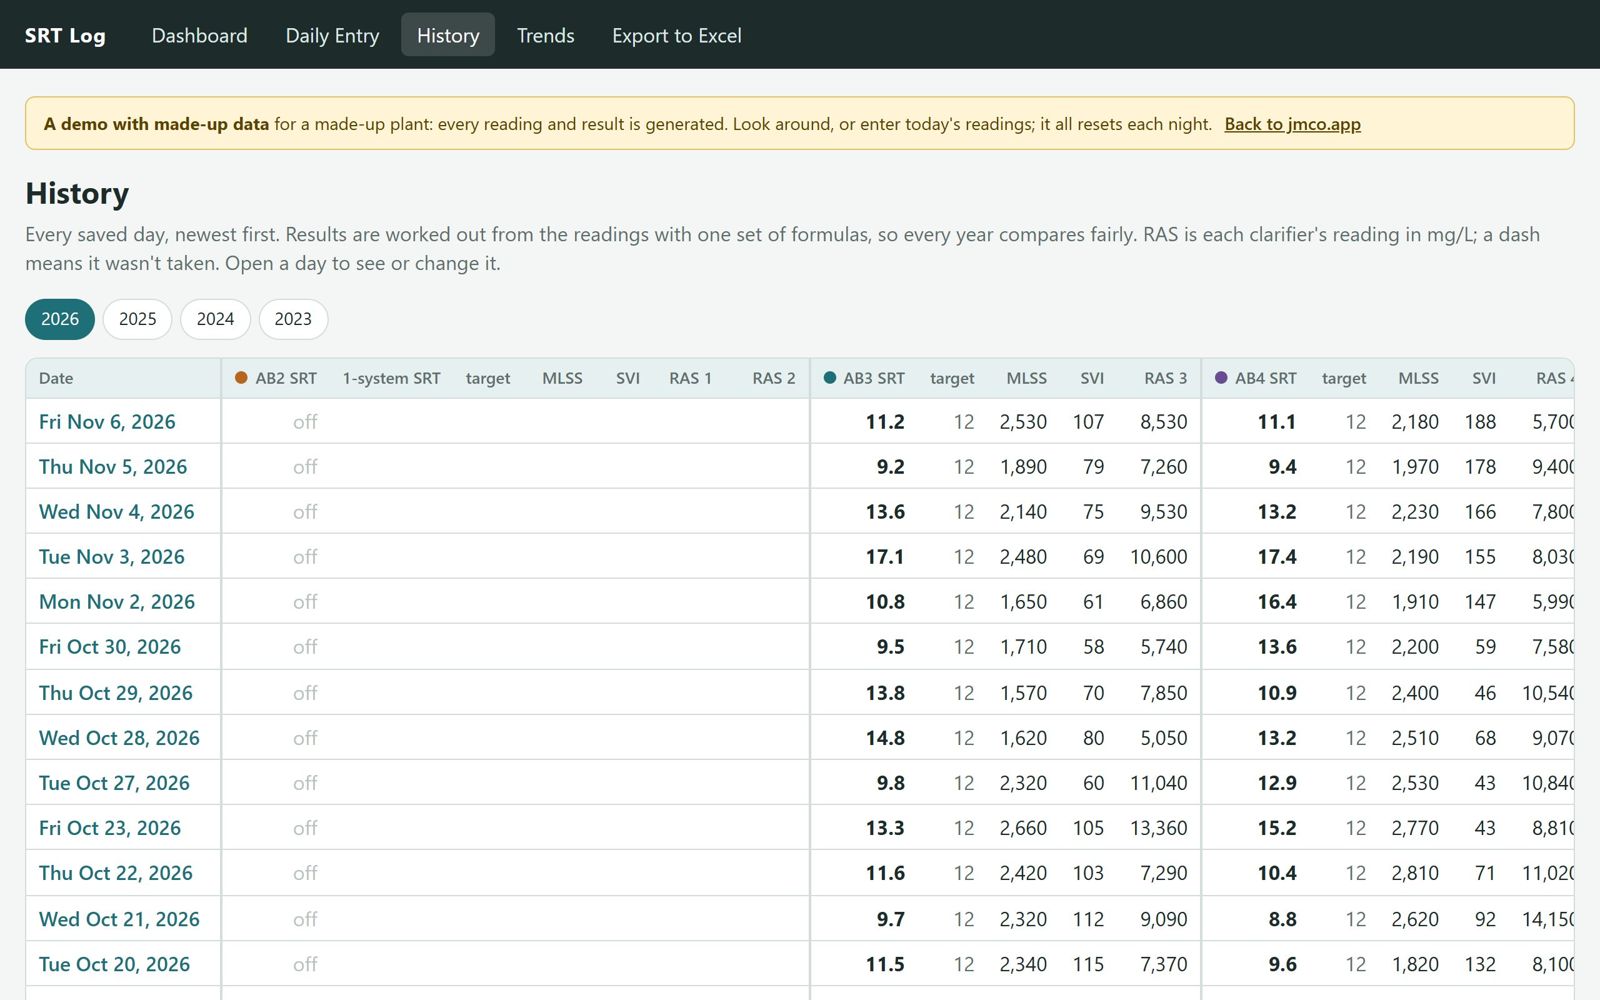
  • Every past day in a table and on charts
  • Your old spreadsheets brought in, years of them
Being built

The monthly report

Your permit's limits, with each month's numbers worked out from the daily results.

  • Monthly and weekly averages, daily maximums, percent removal
  • Exceedances and missing samples flagged as they happen, not at month's end
  • Laid out to check and copy into NetDMR
Being built

Rounds and equipment checks

Operators' rounds on a phone or tablet, in place of the clipboard.

  • Your checklists, by shift
  • Readings outside their range flagged on the spot
  • Missed checks visible to the supervisor
Being built

The plant's documents

SOPs, the permit, O&M manuals and lab sheets in one place.

  • Search by any word inside them
  • Linked to the equipment they cover
  • Review dates, so an SOP doesn't quietly go stale

Every day, one click away.

Results are worked out from the readings with one set of formulas, so every year compares fairly, and fixing a formula fixes every past day.

Runs where your IT says it can.

Plants' computers are locked down for good reasons. So there are two ways to run it, from the same software.

On your plant's own computer

  • Nothing to install and no admin rights: it's a folder that brings its own Python
  • No network calls: it only talks to the browser on the same machine
  • A copy of the data every day it's opened
  • A one-page summary for your IT department, with every file's checksum

Hosted for you

  • Opened in any browser, at the plant or on a phone
  • Each person signs in with their own account and role
  • Updates arrive for everyone at once
  • One organization can run several plants

Your records stay yours

Every reading can be exported to Excel at any time, all of it, in one table. Every change goes on the record: who changed what, when, and the value before and after, which is what an inspector or a new superintendent will ask for.

Your people sign the report

It does the arithmetic and lays out the numbers; your certified operator checks them and signs, as now. It never files anything on its own.

How it starts.

It isn't software you download and figure out. Each plant is set up with the people who run it.

1 · A visit

A day with your operators and lab: what's written down, where, and what gets worked out from it.

2 · Set up for your plant

Your basins, clarifiers, tests, limits and rounds, and your old spreadsheets brought in, so history is there on day one.

3 · Side by side

A few weeks running beside your spreadsheets, until the numbers match and your operators trust it.

4 · Kept running

Updates, fixes and changes as your plant changes, from the person who built it.

The setup is a fixed price, agreed before we start; after that, a yearly fee for support and updates, sized to your plant.

Questions plants ask.

Does it replace our SCADA or LIMS?

No. It sits beside them and holds what people write down by hand today: lab results, field readings, settling tests, decisions and why.

Our IT won't allow cloud software.

Then it runs on the plant's own computer, with no network at all. The summary for IT says exactly what it is and what it does.

What happens to our data if we stop?

It's yours. Export everything to Excel at any time; the local version keeps running on its own whether or not we're around.

We do things our own way.

That's the point. Your tanks, your tests, your limits, your alarm levels and your rounds are set up for you; nothing assumes a textbook plant.

Tell me about your plant.

What you log, what takes the time, and what you'd change if you could. I'll tell you honestly whether this fits and what a first step would be. The first conversation is free.

info [at] jacksonmorinco.com